Thursday, 23 May 2013

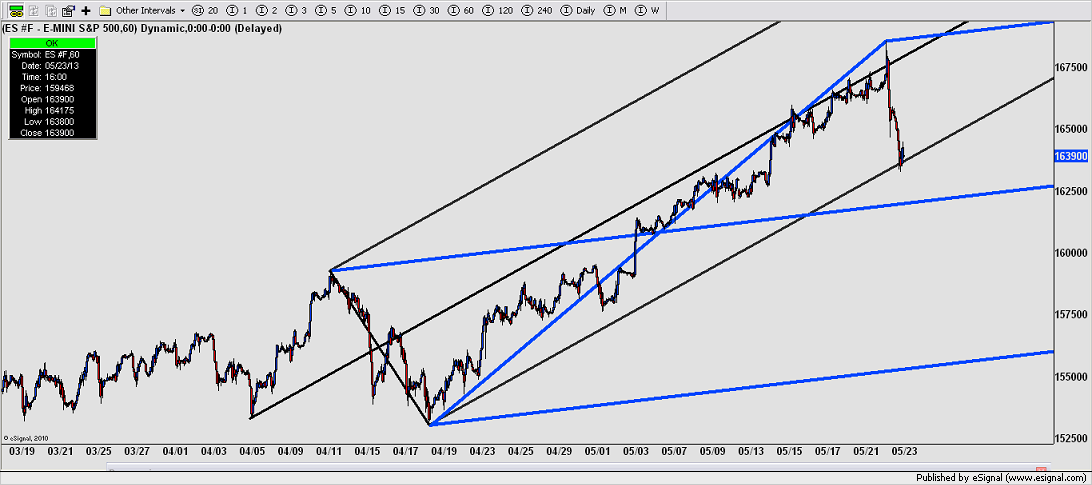
E mini S &P: Will we hold here at 1632.75 on this median line or are we going lower? It looks like a mini pitch fork CL failure and we will go lower

 Will we hold on the LMLP of this fork
 This is the price action/distribtion around this line

 Or are we heading lower towards 1620 and the blue CL?
 Here below is the same fork plus reaction line matrix


Heres the 5 min TF 30 mins before Wall St opens and we have a CL failure SO FAR with this horizontal fork

Monday, 20 May 2013

E mini S &P plus the USDX

Question: What happens when we get confirmation of the easing of the QE stimulus ending as it surely must?
 Answer:...............................
 

The emini S & P -much to my surprise- shows little sign of easing its almost vertical trajectory. Sadly this can only end in tears -but when and how much more is on the table. The financial markets are littered with the corpses of bearish analysts who have stood firm in the path of mega trends and the sad fact is that not only have they been wrong but they have not shared in the bounty that these bubbles offer and i am reminded of the maxim that the top and bottom 10% of every trend are the most dangerous and no one needs that 10%. Not only this but also I have observed that often the last and or final leg up of a trend is often volatile and sharp or a 'run-away'. We all recognise that this move is overblown and the trend is more than slightly hysterical but technically every sign tells me that price is still strong.  Last Fridays (17th May) move up is a classic example. Using simple PF's in multiple TF's you can see that price is still buoyant. However I am now confused as to our near term objective and spent part of this last weekend looking at other US and global equity charts to try to get a grip on this problem. Personally I do not care if we go up or down as long as we have a clear direction to trade and can find a way into that trend and whilst the trend direction is obvious I am unable to get long right now. Since the middle of last week at and around 1655 I simply am uneasy at the lack of a retracement- even a weak one. When the retracement comes it could very easily turn into a rout but there maybe another 80 big points on the upside table to 'feast' on  first. I will watch todays session to see what unfolds and if there is a way out of this dilema.


Lastly, the USDX's CL target area of 85.00 and above is clear by comparison to the confused ES


Thursday, 16 May 2013

E mini S & P: If you want more upside right now your just plain greedy. Now comes some sort of correction....Then my ultimate target pitchfork...

Perhaps we will see a small spike towards 1658 then some sort of correction. The fact that yesterday (and indeed the last few days) the market appears to have been on steroids worries me  and last evenings( Europe time) immediate sell off/ deep retracement of yesterdays move up supports my view and I am now growing (short term) bearish. My indicators are (as always when we see a continuous move upwards) nearly useless and pure fluff and should not be relied on and the short term stoch ribbons have been 'lost' in many time frames stuck on the ceiling.
Here's my ultimate FNL pitchfork for this bull run with a potential Cl objective around 1740-1750 but we may of course fail before we get there at any point..weekly and daily charts:

 And heres a more detailed look at the reaction/median line matrix that presents itself today showing one down sloping reaction line in particular that interests me at 1657 in the lower of the 2 charts below. Video to follow....


Wednesday, 15 May 2013

Tuesday, 14 May 2013

Monday, 13 May 2013

E mini S & P 13th May: A pop higher perhaps today or tomorrow if the low 20's still hold?


Whatever the 'bears' say about this market being oversold I am frankly amazed that last week and today we have consistantly bounced off good support at the lows 1620's. Either price is determined to break lower ( hence our series of lower highs) and restest/ retouch 1610 and even possibley lower or we have now seen a seris of higher lows and good support at the low 20's are are being squeezed towards a breakout from a pennnant (not flag) pattern which should go upwards and fill last nights gap down and take out 1631

Friday, 10 May 2013

Thursday, 9 May 2013

E mini S & P... Centre line objective remains elusive yet tantilisingly close

CL is pink in this chart below

This is beginning to worry me. That's not unusual but we need to hold above 1622 to 1623 to have a chance of hitting the objective at 1635 today and the momentum can weaken and before e know it we have a sharp move back towards the 1610 area. There are a bunch of downsloping reaction lines that are resisting price moving higher some can be seen in the detailed charts above. I will watch the opening with great care as this could go either way and is starting to look  like a possible down day but i hope not. That's not a problem either as it gives us more long opportunities back up towards 1635 and higher and we have had an exceptional run since last Friday so as long as we do not see a serious corrective move down i will be still bullish for the target of 1635( M13) perhaps today or tomrrow.
 Video midday EST.(5pm London)

Wednesday, 8 May 2013

Emini S &P....Plus Victory in Europe Day ( another holiday in europe) Plus UPDATE

The e mini S & P has at last halted with a double top during the European Globex session this morning and has now eased back to 1617.50. We have penetrated the CL of the local d/s fork seen in both chart shots below. The issue is where are we going? We have two options ( obviously) and i think today maybe a down day taking us back to 1614 where I maybe tempted for a long. Remember our objective of the dominant CL and PF lies at around 1632 today ( dependent on price and time) and if we were to retrace seriously last Fridays NFP's move up then we will be ' gone for some time' at lower levels and the current momentum would be lost. Alternatively, a rally from here or hereabouts to restest this mornings failed HH at 1621.75 is a less likely posisbility. My advice is look for horizontal support on historical/important PF's 1614.40,  1616.00, 1612, and 1608 are all strong support. All eyes on the opening in 10  mins.
Today is another Holiday in France ( we have another tomorrow 9th and another was last week on 1st May and please remember every Monday 365/52 all professions such as banks/lawyers/accountants/doctors/vets are always closed)and other European countries Victory Day- and if it were not such an important one i would start my usual Anglo Saxon moaning about " It's a wonder how these Europeans get any work done at all". It ( Victory Day) is for people of my generation (!) perhaps less important than it was as a child in the 60's,70's now that this has passed from living memory and the folk of that generation are long gone and we are I think the poorer for that fact....especially since it has entirely shaped the modern world more than any other event since the birth of Christ. Here below are a selection of my fathers photos of the Liberation of Paris in 1944
 Link 1
Link  2
6 PM London Update


Video link 5pm London

Tuesday, 7 May 2013

E mini S & P.. retracement? What retracement?!

Price has and is giving us the clearest indication that it has every intention of moving higher. Now, having said that it will probably spike lower first- just for the fun of it but even if it does unless we start to see warning signs i remain firmly bullish and will only trade from the long side. I am disappointed that we haven't seen a slightly deeper retracment but all the d/sloping forks that can be drawn off the post NFP data/bars show the same light centre line touch or kiss and then back up.As I write this at 11am London we are sitting at  1615 and suspect about to make a HH. If we go lower before after WS opening it is not a sign of weakness and we will resume our move higher at some point. But...how to trade ES at these levels? Time is a most neglected factor and just like an apple falls from the tree only when it is ready and has separated (abscised) from the stalk; Price is similarly effected by time and moves in relation to time.We can expect a move today or tomorrow based on simple bar counts. Everyone learns quickly that trends do not turn round 'on a sixpence' or reverse within a few bars. Likewise if you examine the past big moves up like we saw on Friday after NFP's you will always see different patterns of consolidation before a move either way but time seems to bind these moves together and the price action that follows them in whatever direction. I still do not think we fully understand the relationship between price and time.
All this being said today we are heading towards the blue centre line in the chart shown below ( TOP). The price when we arrive  will depend on our speed of trajectory (bar length) and time taken to get there. Today it sits at  about 1627 but I also have my eye on the confluence of the blue CL and the black MLP ( again seen below) which is bang on 1630.00. However if we cannot keep the current trend/momentum of NFP's data we may have to come lower again. Considering how important 1600 is psychologically as well as technically I am not sure we are done with it yet and certainly I am looking for a short term high pivot - ideally 1630 before some violence is unleashed on the downside and we go lower to see how firm the support base is at 1600 and underneath it.! But before then we still have the upside open for another strong day... but for how long will this last before the momentum fades?
Watch todays video available from just 2pm London 9am EST
:http://commodity-analysis.co.uk/Video_reference.htmlhttp://youtu.be/i2h61Ty3zrQ


plus if you want a real laugh read this ( if i had a trading record like this i would be sacked)

Bloomberg News

Paulson Said to Lose 27% in Gold Fund Last Month in Rout

Monday, 6 May 2013

E mini S &P..stalking the retracement for optimum long entry towards our target of about 1622 ( M13)

  Checkout the Fib RT levels for my target of 1599 ( support from big black fork in esignal chart below that has Jan 1st gap as P0 and the mid & late Feb LH part of the H & S pattern as P1& P2)..however life rarely works out like this in practice and i suspect that failing some fundamental new story we will see a shallower RT above 1603/1604- but I live in hope


Friday, 3 May 2013

Emini S &P.. Non Farm Payroll- chaos to come!!


 Watch free video with RL analysis of pre Non Farm Payroll emini S & P.....I suggest that we will go lower first before any break out upwards.http://youtu.be/RgIfkSNiOrM

Thursday, 2 May 2013

E Mini S & P: I am getting nervous the trend maybe about to stall + UPDATE 2pm EST

UPDATE VIDEO 2PM NY/US EST.. "what a difference a day makes" as the famous Dinah Washington song goes...well what a difference a few hours make to what i wrote below at the time of the ECB rate decision

No one ever said it was going to be easy pushing through 1600 and those of us who have been around a while and have seen  previous big trend start to turn are also worried. Throw into this mix containing an  uncertain  technical picture a new and  growing awareness in the investment banking industry that we may have peaked at 1600 plus the weakening economic data and you have a recipe for a perfect storm. I will leave the fundamentals arguments to others who can talk the hind legs of a donkey on the macro economics but lets look at the charts and the price data contained therein plus also let me draw your attention to the B-line slow and fast stochastics ( called the ribbons: 7,3,3/ 5,3,3 and 9,3,3 I add an extra set which for me aids visually but Buffy uses just the 5,3,3 and 9,3,3 plus the long stoch or "B line)which look very threatening in the daily and weekly charts. They show what i call the "waterfall" position...about to fall after cresting at the top. We have just seen a complete failure to reach the CL of this purple fork after an initial spike on ECB rate decision:
I have a growing and nagging doubt that we may see a vicious move lower in the next few days. I was surprised ( and stopped out) by yesterdays correction lower but I am not sure we have seen the worst of it.
Take a look at these two charts showing the bundle of down sloping reaction lines that has caused yesterdays fall and indeed if you look back before yesterday you will see a good reaction line correlation with price throughout the history displayed.

 
Now, as for today? I am waiting for the opening at 2.30 BST, 9.30 USA EST but it looks extremely worrying after this mauve ( grey in the RL charts)  forks failure......beware. ( video to follow at 4pm London)

The song What a difference a day makes!!

Wednesday, 1 May 2013

E mini S &P. These two simple pitchforks will reveal prices current intentions


This is one of the dominant current upsloping PF's from a decent time frame:
 This blue D/S PF will draw price to it's centre line. If we fall through the U?S black UMLP then lower we go.
  Heres a more complicated picture: