USDX has held (so far) at 78.60, Gold tops out at $1777 and EurUsd hits 1.3170 but US T- bonds look like they have found support on my LMLP ( see previous posts).
An endless open committment for $40 bill a month and all so far is about 40 big points on the emini S&P
. All we need now to evaporate that is a pre emptive strike by Israel on Iran (and there are current rumours in diplomatic/political circles that this is on the cards before the US pressi elections) and we may end up back where we started or lower.So what does the next few months hold in store? How on earth will the Feds action whereby it buys from banks/institutions who then reinvest in stocks or other asset classes effect the average man on main street USA and create wealth... Understanding and getting ones head round the macro economic effect of recent monetary policy is difficult for me perosnally but I do agree that a large rally in stocks does not seem a rational outcome since we are already 37% higher since a year ago ( $SPX) but then markets are simply not rational and no longer seem correlated to the wider world and economy and are ostensibly driven by cash rich banks/institutions with eye watering amounts of cash to pump around various asset classes. Here is a most encouraging appraisal of the current situation Why QE3 cant work by Joseph Stuber reproduced here without permission ( ooops!sorry) from Seeking alpha.( link at bottom of page)...It all makes perfect sense however i for one am not considering shorting the S&P and if anything expect to see 1500 rather than 1400 by Xmas 2012
The bottom line and my final word (today!) on this subject ( the words below are of course by Joseph Stuber) is that if it looks like a rising market, smells like a rising market, feels like a rising market then......it is a rising market and bollocks to the marco point of view -I will buy any significant retracements and especially if fundamentals cause a volatile sudden dropfrom euro concerns or Israeli 'projects' etc.
http://seekingalpha.com/article/869461-why-qe3-can-t-work-understanding-the-liquidity-trap
Why QE3 Can't Work: Understanding The Liquidity Trap by Joseph Stuber
Disclosure: I have no positions in any stocks mentioned, and no plans to initiate any positions within the next 72 hours. (More...)
The Fed's move on Thursday to a massive and open ended
injection of money into the U.S. economy certainly had an impact in the
short term as traders tried to assess the significance of this new QE
initiative. It pushed stocks higher and bonds lower in a rather dramatic
knee jerk reaction to the announcement on Thursday. How effective the
plan will be over time is a matter for careful consideration.
The
markets had moved 8% to 12% higher - depending on the stock or the
indices one looks at - over the last 6 weeks. Another percent or two was
added Thursday after the Fed's new QE - an open ended bond buying
program of unprecedented size - was announced. As a trader I admit to a
moment of hesitation as I tried to process the impact. I monitored the
stock indices but kept glancing over to bond yields, the metals and
crude.
What caused me some degree of confusion was the movement in
the bond market. The short end of the curve was falling and the long
end rising. The Fed's new program wasn't a sterilized purchase like
Twist - we were creating new money here - so the short end of the curve
falling didn't make sense. Even more confusing was the long end of the
curve. Traders were selling bonds and selling them hard. Why? With the
Fed committing to buying mortgage backed securities in large quantities
the long end of the curve should be stable or falling I reasoned.
I'm
not a bond trader and admit that I don't have all the answers but the
movement didn't make sense to me. There was something I wasn't
processing about all this. I jumped on the Federal Reserve website and
read the statement. It seemed a little ambiguous. I wasn't sure if the
plan was to buy the bonds on the open market or if the purchases were a
normal QE designed to add additional liquidity to the banking system.
It
was important to me to know the answers to these questions. I have done
a lot of research on QE's impact to the relevant metrics over the last
several years and a program designed to add liquidity to the banking
system in my opinion was a non-event as we have been stuck in a
liquidity trap since the Fed began QE. The proceeds from those purchases
would end up being trapped money - setting on the balance sheets of
banks and doing nothing.
On the other hand, if the purchases were
going to occur outside the banking system then the impact would be more
significant. $480 billion a year injected into the economy is huge -
almost 3% of GDP. That would be new money and would leave the total
money supply flat even after the "fiscal cliff" tax hikes and spending
cuts occurred. The Congressional Budget Office has projected the deficit
to be reduced by about $500 billion next year and the Fed was
effectively making the impact of the tax increases and spending cuts a
non-event - at least from a macro point of view.
I admit to still
being a bit confused as to how this new money will impact GDP but for
the moment at least I have decided that most of the new money would
likely flow directly into the stock market. The aggressive selling of
bonds along the long end of the curve suggests to me that these bond
holders are dumping bonds and planning to move to stocks and metals
anticipating ramped up inflation. There is really no other reason that I
can come up with to explain why long bond yields would climb when we
already know the Fed has every intention of holding yields down on the
long end of the curve.
This is significant in that the Fed's money
for these purchases will likely go to banks or institutional investors
and therefore be reinvested. If my logic is sound the impact will be
diminished as the velocity of this new money will be comparatively low.
The Fed buys the securities from a seller - the seller takes the money
and buys stock or another asset and that is that.
Perhaps I'm
missing something but I'm pretty sure what's needed is to break free
from the liquidity trap we are stuck in due to fear and uncertainty and
driving stocks and metals higher will not achieve that end. As an
analyst, this new QE has increased my fear and uncertainty - not reduced
it.
If all that's happening here is that the Fed buys agency
securities from institutional investors and banks and the institutional
investors and banks in turn buy stocks or gold it will add a modest
amount of upward pressure to the price of stocks and gold. It certainly
won't flow into the broader economy where the velocity of this money
could work to spur significant GDP growth.
$40 billion a month is
relatively insignificant considering the total capitalization of all
publicly traded companies is in excess of $50 trillion. The possibility
is real that these funds will work to drive stock prices higher if the
trend is higher to begin with but the dollar amount is probably not
enough to significantly alter normal market action or direction. High
frequency trading algorithms will absorb and overwhelm the volume
created by the Fed's action.
In the end I decided we were still
dealing with a liquidity trap. For the Fed's plan to work and break us
out of the liquidity trap we are going to need more than a stock market
rally. If the market response to the Fed action on stocks and bonds
translates to a similar reaction on the part of local banks and
consumers the plan will work. If consumers react with more disgust and
more fear the plan will fail. It is really that simple.
Perception Must Precede Fact For The Plan To Work
The
Fed's plan - although they deny it - is to induce an inflationary
environment. Perception precedes fact in this instance. If public
perception is that we are entering a period of high inflation two things
will happen:
- Bank lending will increase
- Consumer borrowing and spending will increase
As
massive as the Fed's move is from a historical perspective - if my
analysis is correct - it will have minimal effect on the broad economy
as the money won't flow into the broad economy. Additionally the
velocity of this money will be nil since it won't flow into the hands of
the broad population where it would be used over and over again as
people buy and sell with the money driving GDP.
That leaves the
Fed action impotent unless it works to change Main Street's perception
of what's to come. That seems doubtful. Notwithstanding the fact that
this is a move of huge proportions - a "shock and awe" move - it is
doubtful the public will recognize this fact or even care. If not, it is
a "dead horse" strategy and you can't win the race on a "dead horse".
There
is very little empirical evidence to support quantitative easing as a
legitimate strategy to affect the desired result. Japan's experiment
with quantitative easing is perceived as a failure and critics are quick
to point this out. As Bernanke readily admits in speeches and
statements the Fed is learning on the fly as evidence of non-traditional
policy impact is limited.
Ben Bernanke's legacy is clearly on the
line. Prior to the Fed's announcement I speculated on the odds of a new
round of QE and discounted the possibility setting the odds of QE3 at
zero - a rather bold and ridiculous assessment on my part in retrospect.
My logic was that additional QE would not manage to stimulate bank
lending or motivate consumers to shift from a cash hoarding mindset to a
free spending mindset.
As a part of my analysis that led me to
conclude that the Fed would stand pat I did consider the possibility
that the Fed had two choices - do nothing at this point or enter into a
massive "shock and awe" stimulus plan. The second choice is wrought with
risk. My thinking led me to the conclusion that now was not the time to
take big risks. It is the Fed's last bullet in their policy gun. If it
fails Bernanke's legacy goes down in the history books as an abysmal
failure.
We may not know for some time how the Fed's "shock and
awe" stimulus will translate in the broad economy but we can at least
look at where we are and attempt to speculate on what the Fed's policy
move will mean. I don't think it is logical to give Bernanke a passing
grade at this point. This unprecedented move is analogous to being down 3
runs in the bottom of the ninth with the bases loaded and the batter
down in the count 2 strikes. Anything less than a homerun is meaningless
- the game is lost.
Liquidity Trap
Real
economic growth must be built on the backs of the consumer. When
consumers hoard cash out of fear no economic expansion will occur
regardless of monetary policy.
Karen Murdarsi, in her article, "
Keynes and the Liquidity Trap", explains in an easy to understand way what Keynes meant by liquidity trap:
Why
did Keynes believe that government spending was the way to break the
cycle? To answer that we need to look at the other ways of controlling
the economy.
1) The government (or the central bank) can
try to reduce the 'price' of money by lowering interest rates. The laws
of supply and demand say that low demand reduces the price of goods to a
level where people want to buy them. In the case of money that would
mean reducing the cost of borrowing, i.e. interest rates. The trouble is
that in a recession, people may be so unwilling to borrow and invest
that it is impossible to reduce the price far enough. Once interest is
at zero, there's nowhere else to go.
2) The government
(or bank) could increase the money supply - they could literally (or
electronically) print more money. The idea is that this money will work
its way around the economy, allowing people to spend and invest more,
and increasing employment. The trouble is that when times are bad people
want to hold on to their money. They don't want to invest it in stocks
which might fail, or spend money on goods and services when they fear it
will leave them short later. They feel safer holding on to money in
'liquid' form (CASH) which means that all the new money released is
hoarded by nervous banks and savers, and does nothing for the wider
economy. This is what Keynes identified as "the liquidity trap".
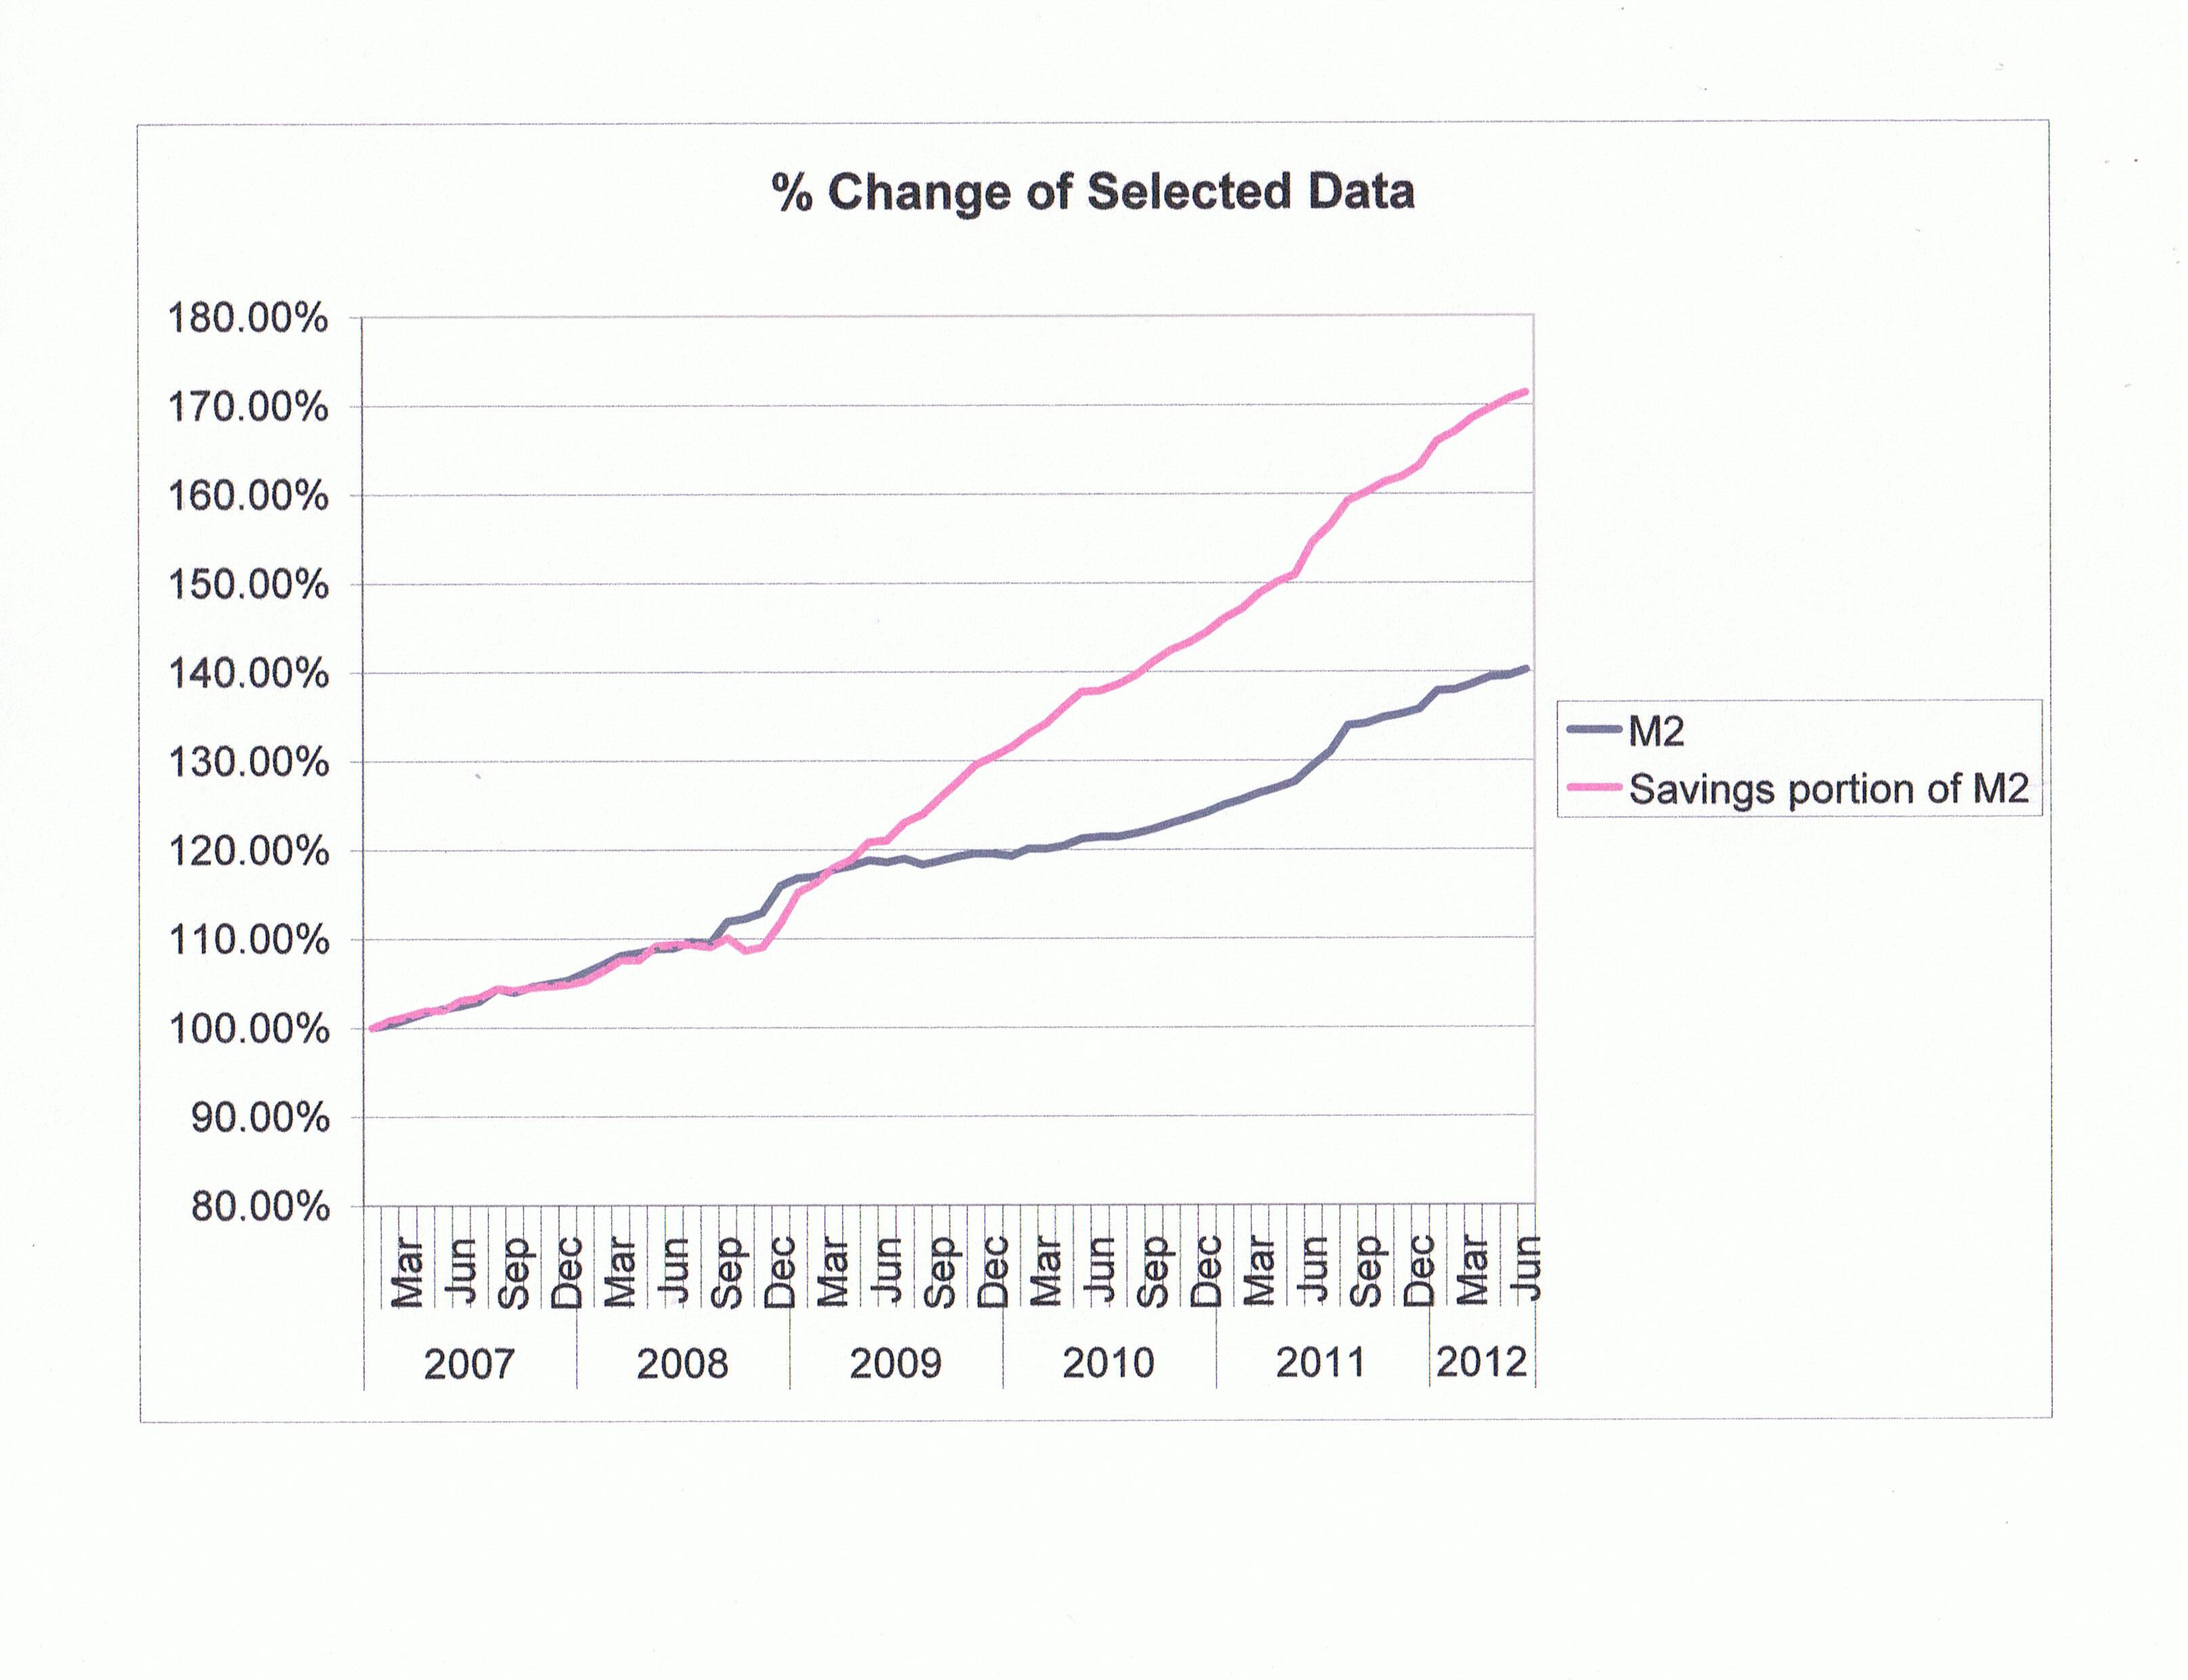
The
chart below clearly shows that through QE1, QE2 and Twist America's
recovery has been stuck in a liquidity trap. What is particularly
interesting about this chart is that M2 and the Saving component of M2
were closely correlated from the beginning of 2007 until the Fed started
QE1 in November of 2008. From that point forward the Savings portion of
M2 moves higher at a much faster rate.
click to enlarge images

Perhaps
we cannot conclude with certainty that the Fed's QE programs were the
motivation behind our sudden propensity to save. What we can conclude
with absolute certainty is that the Fed's QE programs did nothing to
quell our fear since American's started a process of systematic savings
that has continued without a slowdown from the time QE began until the
present.
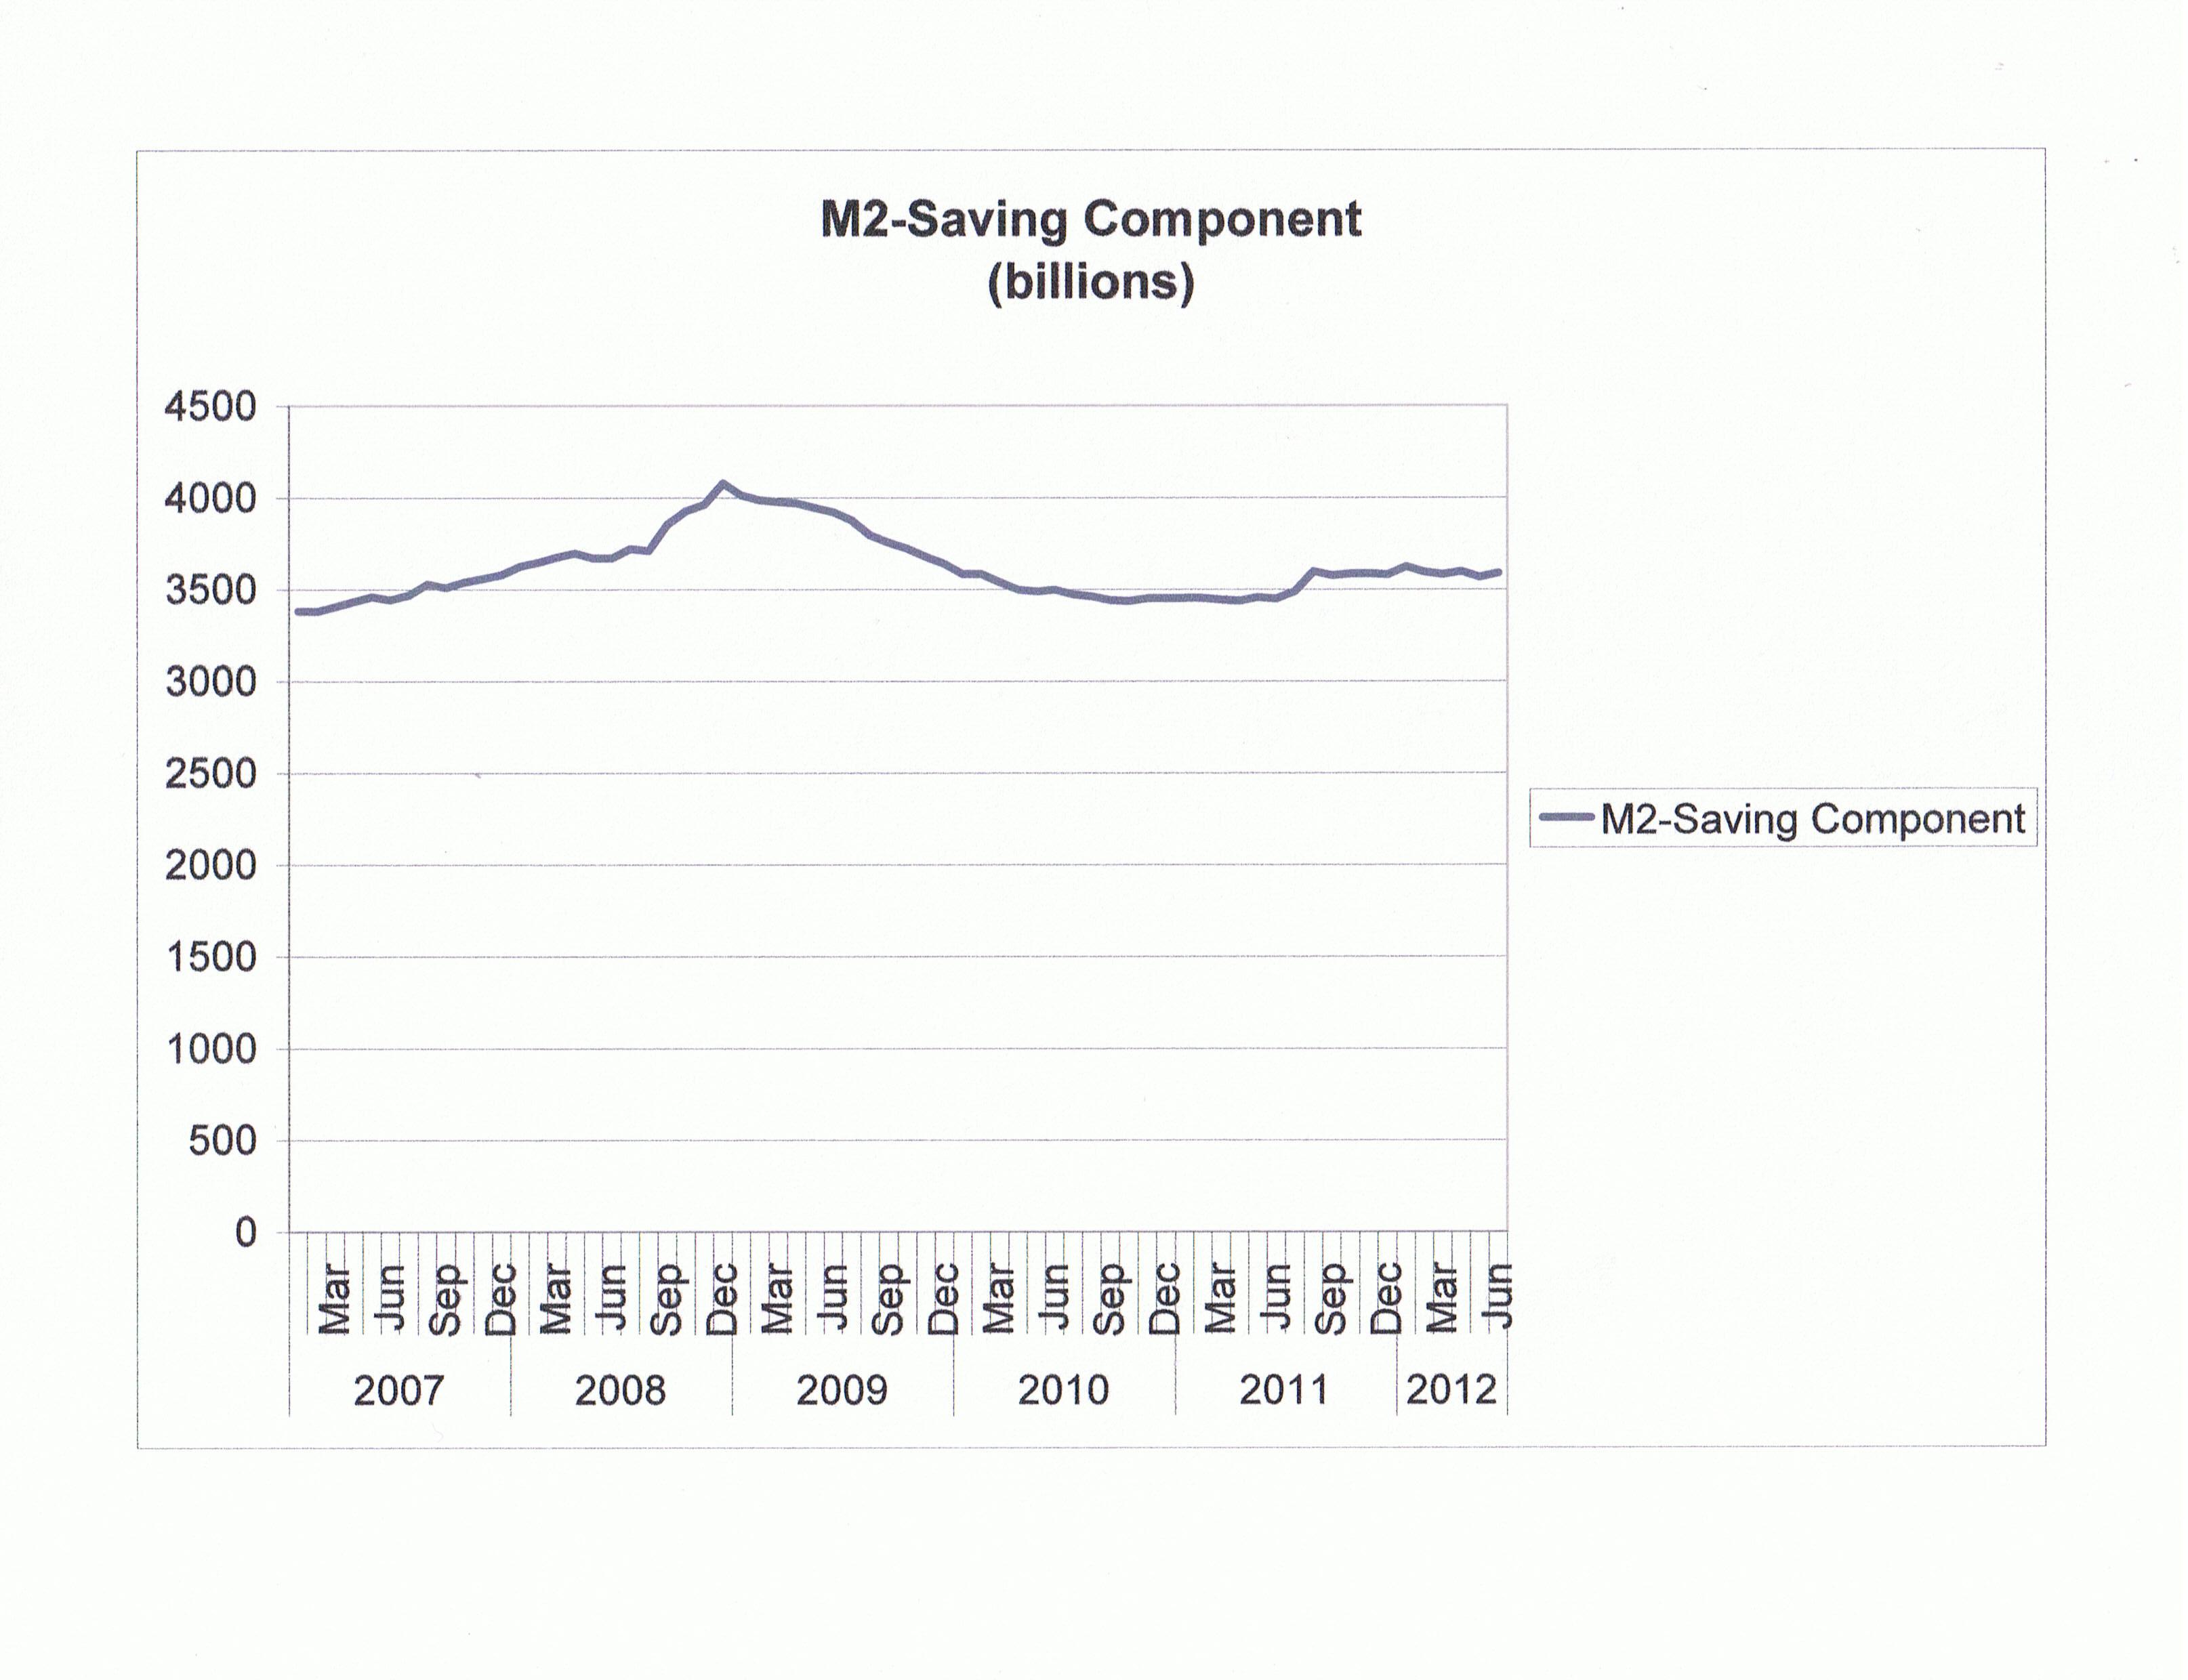
The next chart shows the real impact of the liquidity
trap. This chart shows the spendable cash in the economy - cash that
drives GDP growth. Spendable cash is calculated by subtracting the
Savings component from M2. Take note of the fact that real spendable
cash actually fell from $3.963 trillion in November, 2008 to $3.589
trillion today.

Looking
at just this single metric it is clear that monetary expansion has not
achieved its intended result. The Fed's balance sheet has increased by
approximately $3 trillion since they started QE. Almost all of that went
into savings - not into the general economy where its effects would be
multiplied as it moved from one hand to the other. Money velocity has a
multiplier effect on GDP growth. As money changes hands it is spent
again and again the result being a single dollar might translate to $5
or even $10 in GDP.
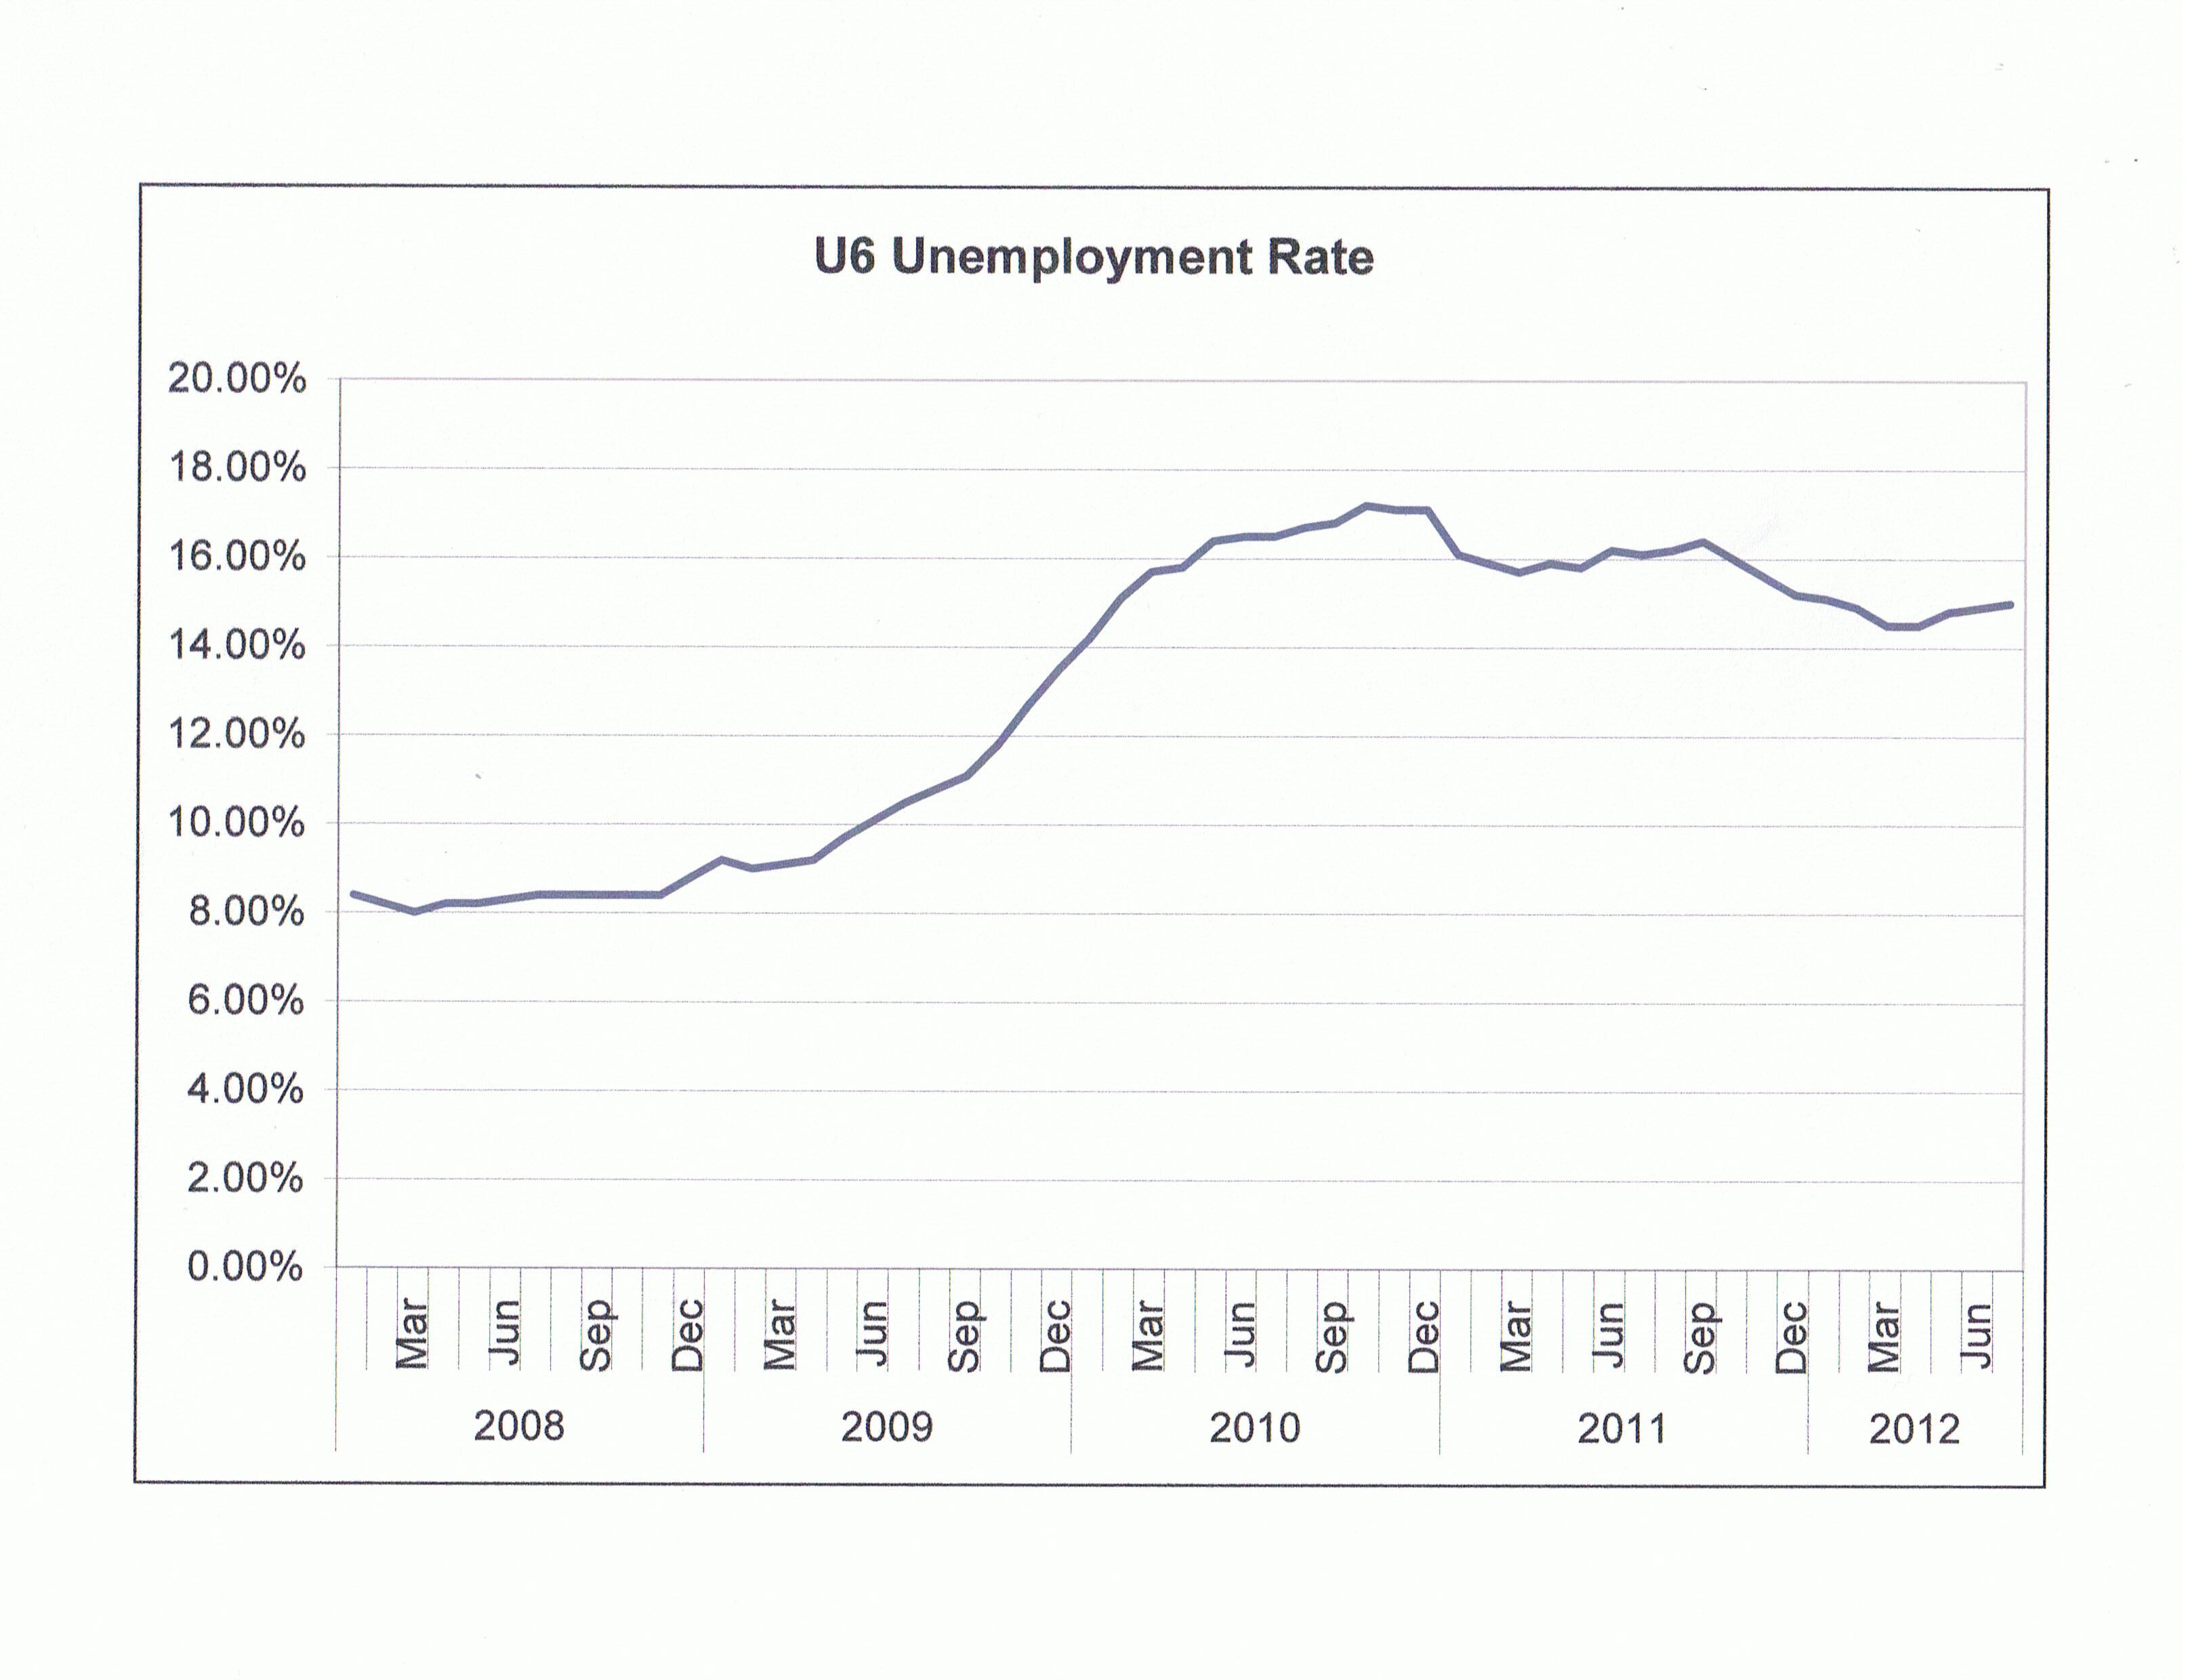
Let's look at another metric - unemployment.
There is a very strong correlation between the chart above reflecting
the reduction in spendable money supply - resulting from an increase in
the rate of saving - and the U6 Unemployment Rate. Spendable income
peaked and started its descent in the 1st quarter of 2009 at the same
time that U6 unemployment rate started its climb.

Without
an increase in spendable money GDP can't grow and without GDP growth
unemployment can't fall. Let's look at another metric - GDP growth:

The
chart above shows real GDP growth and inflation adjusted GDP growth.
After accounting for inflation there has been no growth in the economy
at all. This has to be a huge disappointment for Bernanke.
The
take away from all this is that for the new "shock and awe" plan to have
it's intended effect we have got to break free from the fear and
uncertainty that has gripped the nation since the recession. To date we
have made no progress at all in any of the major metrics that we look
at. As Keynes states:
".. if
Investment exceeds Saving, there will be inflation. If Saving exceeds
Investment there will be recession. One implication of this is that, in
the midst of an economic depression, the correct course of action should
be to encourage spending and discourage saving. This runs contrary to
the prevailing wisdom, which says that thrift is required in hard times.
In Keynes's words, 'For the engine which drives Enterprise is not
Thrift, but Profit."
Where's The Market Going From Here?
From
a trader or an investor's perspective what we need to figure out is
whether or not we should ride the "Bernanke bull" or get off now. It's
been a nice ride for the last several weeks but can it continue.
My
conclusion is that even under the best scenario - a massive increase in
inflation - we have probably priced in the full effect. In other words
if the Fed's plan works to raise inflation to maybe 4% - which is in my
opinion the outside limit of inflation expectations even if the Fed
policy does shift consumer sentiment - that and more is already priced
into the market.
We can momentarily get caught up in the euphoria
but really how high can we expect the market to go on the backs of even
an overwhelmingly successful outcome where the public jumps in with both
feet and starts borrowing and buying with frenzy? Consider that the
October low on the spot month S&P 500 futures contract was 1068.
Friday's close was 1465 - a 37% increase. There is no way inflation can
support that kind of move.
You can argue that the October low was
not reflective of the real economy if you want and therefore the 37%
move in the market is more reflective of reality. I would take the
opposite side of that argument and offer up the following facts as
support for my argument:
- Depression era unemployment numbers.
- Flat GDP growth.
- Liquidity trap that is locking up all Fed stimulus money.
- Pending fiscal cliff issues.
- Eurozone recession.
- China contraction.
- Record debt to GDP ratio.
- Failed monetary policy.
That's
a short list. If the S&P were at the bottom end of the 12 year
trading range I might be a little more positive but we are not. We are
at pre-recession highs and a comparison of economic metrics today versus
when we were at these price levels pre-recession provides a shocking
contrast in economic health.
I have said we are our own worst
enemy as it is only through the collective population's increased
confidence that we will start to borrow and spend. The Fed hasn't
provided that confidence with their policy moves. On the fiscal side it
is the same thing. "We the people" just aren't buying and without us no
policy move matters. As long as fear and uncertainty permeate the minds
of the people they will be prudent and cautious. As long as that
continues we will continue to stagnate as an economy.
Monetary and
fiscal policy - had it worked - would have made sense. It hasn't worked
leaving us in a far worse position than before these massive stimulus
initiatives. Now we are dealing with the added problem of credit
downgrades. As bond prices begin to reflect in the downgrades and they
will, we have the added burden of a dramatic increase in carrying costs
on these huge debts.
In conclusion, I think Ben Bernanke goes down
in infamy as the one who created the monetary policy stock bubble of
2012. When will the market bubble finally pop? That's anybody's guess.
My guess is this coming week. There is no rational justification for
stocks adding on to a 37% gain in a year. Even if one sees the Fed
policy as positive the market has already discounted the perceived
success of the policy.
http://seekingalpha.com/article/869461-why-qe3-can-t-work-understanding-the-liquidity-trap
US T-Bonds
ES U12
Gold


