Monday, 7 May 2012

Hollande et Le CAC40 ! ( & S&P/EurUsd)


Shortly after I moved to France with my family in 2005 Sarkozy was elected to be the 8th president of the 5th French Republic. I will never forget that at that time there was great optimism and excitement about the prospect of change, opportunity , wealth creation and for the stripping away of punitive taxes and red tape.The feeling in the country was palpable and I clearly remember the next morning being spoken of as a new dawn... Sarkozy was to be the Margaret Thatcher of France, dragging her forward and into the the age of prosperity. But things change very slowly in France and it beyond the remit of this blog to list the endless disappointments and failures of Sarkozy's tenure in office even with the crunch/crash of 2007/8. A lost opportunity is an understatement. Last nights vote was as much of an anti- Sarkozy vote as a pro Hollande vote. But then austerity is never an appetising fiscal option to sell and Sarkozy had already had his golden chance and blew it and his policies in review were devisive and misjudged/ill timed/ lacklustre and most of all not ambitious enough.
 I cannot tell what will happen in the future but I suspect this election and the other European elections this May may be part two of the final act of the current hit drama called the Euro Zone (as we currently know it). The forces that bind the EU together are no longer greater than those forces that divide it.


What implications will last nights elections ( and lets not forget Greece)  have on European economy and the markets? This morning we seen important 'gaps' down on the charts. Here is the chart i showed a few weeks ago when i noted that price was not going to touch the centre lines ( see arrow on chart) of forks D-E-C and A-B-C and the reaction lines shown in dashed red from both these forks that 'caught' price and carried it higher where it failed to make a HH at the same time the S&P ( M12) was poking around and just above the 1400 level..There is no doubt in my mind that there is now an extremely high probability of price reaching the CL's of these forks. But first...How will the gap situation play out? I suspect we may see the gap closed today or tomorrow ( note the European market holidays. UK today/EU tomorrow) but i expect that fundamentals will drive this market very fast over the coming days and weeks. For myself , I will watch to see if we have a classic retouch on the underside of the RL this would be at the important psychological level of 3100.on the CAC (M12) and we now have two low time frame forks to seek a short entry/trade off (should the conditions arise). There is also an reaction line at 3095.50 around which i will observe price.


Moving on....What does this all mean for the US$/USDX and the €$ pair?? The DX has just had its first push above 80.00. I think we have recently made a new low pivot at an important confluence point of both ML's and RL's... More to come

Friday, 4 May 2012

Gold....Ohh Shucks...It IS a dead cat bounce + S&P

After getting stopped out of my Gold position I looked on as we saw the market rally to 1647 for a restest of 1650...perhaps a retouch of the newly added fork....Anyway whatever line it was a retouch of , Gold is now in freefall and currently has dropped nearly15$ in the last 30 mins and we are back under the downsloping RL. Think of the candle/bar in a high TF such as the daily or 240min?
I hope you can see what i was aiming at-or what type of price action i expected-albeit on a much smaller scale and thought the high pivot would be around or just above the RL as per my trade. Anyway 'a miss is as good as a mile' as the saying goes and my old foe impatience is perhaps again to blame...
The bottom line is that todays price action in the S&P/Dow etc and the European Indices and Gold, Crude is a game changer in my opinion and we are back at the same short bearish scenario that i meused with back in very early April
The patterns now in the Dow and S&P are bearish again for the medium and perhaps the longer term and it looks as though the technicals may tie in nicely with the weakening fundamental picture again.
I intend to post some high time frame charts this weekend.
AS for the final word on Gold? No re-entry for me (ever) using the same setup after a failed trade so I am off soon to start the weekend. You should however watch this reaction line (from the blue horizontal fork P0 1662.98 6/March, P1 1716.43 on 12/March & P2 1612.22 on 4/april) ..
                                                                      YM M12 below

 and finally E Mini S&P
.If this blog illustrates anything it is that reaction lines are the most undervalued dynamic line tool in the traders toolbox.

Gold & EP M12 S&P trade


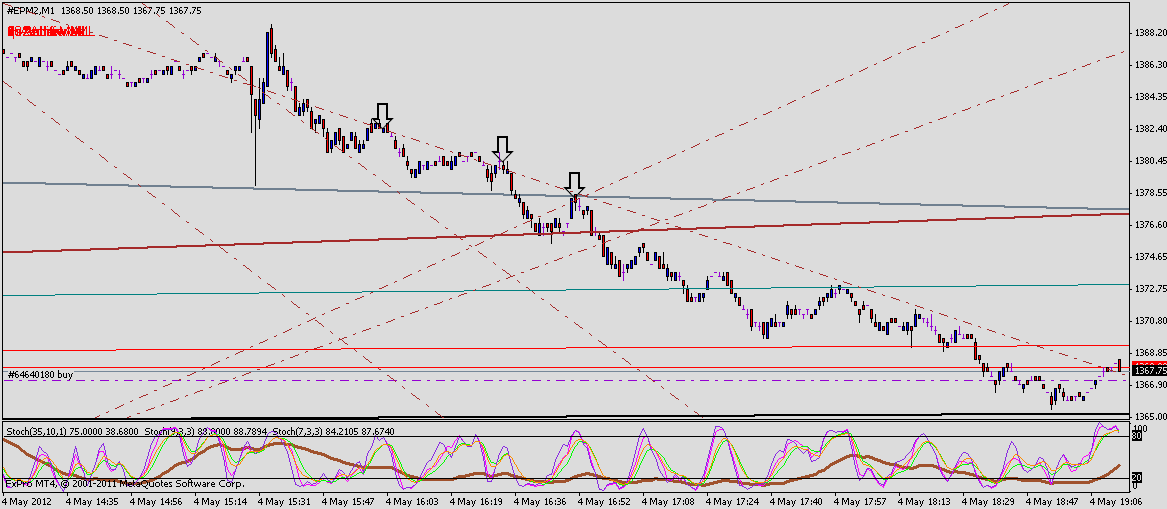
Gold stopped out and EPM12 was a -@1382.50/stp1383.75 closed @1374.50


Gold and EP M12 S&P trade

Short gold ( Dead cat bounce?)& Short June S&P

Explanation to follow

Gold


Do you remember this view of Gold that i posted months ago? ( 2nd LINK) Ultimate target $1450 and I have remained my bearish position depsite some colleagues who have ridiculed this objective and market view (and of course contrary to the many market commentators who are eternal Gold bulls and are constantly given TV airtime). Certainly i think we will test $1573 this May. If you wish to consider a short position watch price action today as we retest then perhaps fail the green trigger line or the red reaction line seen here in the lower of the three charts. Of course we have bounced thrice off the 1612 & 1622 & 1625 level BUT yet price persistantly is coming back to test this area and fails to make a HH after each visit.A big  fundamental 'shock' today and over the weekend (Non-Farm PR's French elections/EZ worries/China/US data) would give the impetus to sail down through here with some long range bars. Of course we must also understand that price may fail again to break down through this support level....in which case all bets are off and we could go higher (ie make a HH over 1670) but my money is still on the downside.Lastly below is another reaction/median line study of Gold (with all indicators removed or collapsed for greater clarity) showing a supporting RL from a high time frame weekly fork (thick brick red) and two ML's that bisect and constrain recent current price action.


EP M12 I dont like the look of this even more than before

After crappy EZ PMI data we see the EP M12 on critical support. Oil and Gold and the EurUsd are all well off in the morning session and I think today will see either a break lower and back to the bearish scenario i was talking about before the recent & surprising rally off the lows upto 1400 area or a rally back up to restest 1400. I think we will hold above 1385 until this after noon then see the direction and sentiment one way or another.

Thursday, 3 May 2012

EP M12...I don't like the look of this at all!

 All eyes are on a new intraday low taking out first 1391 and then 1389.25 ( June12).. What a spectacular and rather sad end to current hopes of getting a close over 1400. How far back will we go? Is this just a period of consolidation with support at 1380-85 or is this a new game ?? ( see the RL arrowed...what a peach !!)


Here the culprit I believe can be seen below in the 240 min chart in the form of a reaction line seen in thick dark red going form top left to lower middle right centre. (the thin dashed line above and parallel to it is it's location on arithmetic scaling and the thicker version is the log location)


EURGBP and USDX...continued

Often i find the simpler the better ! Here is yesterdays chart updated...Not only have we rested the pink trigger line A-C extended but also the LMLH/LMLP of a new modified Schiff fork using the mid point of BC to D & C runs along the same axis and has provided price with a new low pivot plus a new CL objective around/near the .8145 level.... Yes , of course this is much over simplified and there is a huge amount of market structure not marked onto this chart- however..All we/I need to know is that if price makes it to .8145/50 then this pair is worth watching as it may go to the CL of the very feint grey up sloping fork off pivots C-D-E.
USDX... I have a feeling we maybe seeing the end of what i had hoped would be a new ( short term) low pivot for the DX at 78.66

Wednesday, 2 May 2012

EurGbp, USDX and historical Pitchforks + Gold fails to impress.

EurGbp came back yesterday to retouch the underside of an important Mod Schiff median line that has become a pivotal support/resistance level and coincidentally lies at .8195 and at (or near enough) the 'psych' level of .8200. A simple Andrews fork (here above in blcak in the 15 min TF)on an uncluttered chart then showed a centre line touch failure in the 5 min TF and 'hey presto' we were off downwards in spectacular speed and style and have now made a LL. There is a rather peculiar/ tenuous head and shoulders (3o min TF) pattern that would have provided several short entries if you had not traded off the failure itself or even the spike up and through/retouch of  the long term ML seen here as the thick blue ML.Price has now bounced off it's 'trigger' (line A-C extended) seen here in pink.What really matter to me is how this recent price action looks on the 240 min and daily and weekly/monthly charts and it's pretty conclusive in my opinion. Incidentally I did not take a short or any position and have been watching this pair over the last week or two around this historical M-line for any sign of a reversal. I think price has made its intention clear but still wait for the break of the trigger line.
I surmise that we will now see further weakness in this pair and also EurUsd which i have deliberately avoided last week as its recent price action was not 'trader' friendly. Perhaps current fundamentals will now start to be reflected in this pair as well as against Cable. EZ Fundamentals that frankly scare the b'Jesus out of me & when one looks at current pricing around 1.3200 it could /should easily loose 300 basis points to reflect the current conditions. Certainly there seems little support/market structure on the EurGbp pair until .8060 and then .7700 but more worryingly are questions now arising over recent US data and what is going on with the S&P?


Last week and in the previous post i alluded to my recent bearishness and how i was coming round to the idea of continuing upward strength after the recent eye watering rally from 1354  and most importantly a clear breach of the previous high from this March of 1419.50 was needed .  The Dow has made a recent new HH and yet today we have seen the June S&P under 1400 and as i write at 1390.00 and at the CL of the grey fork ( see above).... To be honest this looks a tempting buy area and even with today's fall this market would need some shocking headlines and loss in confidence to break below 1380 where i would concede that my former bearish scenario is still in play. The RL's in the charts below have channelled price lower. If we come back to 1385 however there is support and that would still be under a 50% RT of the recent sharp move up from 1354 and i would also venture to find a long setup.

Lastly Gold: As per the previous post i was starting to see signs of support and thought that last Friday we might break out upto 1680 but we have failed at the same RL that has held price under 1680 on each recent successive move up since March this year. Medium term I am bearish but it looked as though we were going to make a higher high Frankly it looks weak and we have failed in the many up sloping Andrews forks that can be drawn in meaningful time frames. A break above 1669 would be bullish and consistant testing of 1650$ gives me concerns that we may go lower but at the moment I wait and watch.

Friday, 27 April 2012

Gold....Has this market turned? EP M12...Objective reached

Recent price action in Gold suggests we may have seen the short term lows and we are heading back towards 1670-1680$. This is based upon repeated sharp tests to the downside and firm support seen at 1620 plus a higher low at 1624 on 25th April. We are clearly going to break out of the current green d/sloping fork( black in the MT4 chart) after repeated tests on the upper MLP (MLH) and a pair of down sloping reaction lines that have channelled price lower after/since the first attempt to break up through the line yesterday..

Finally the S&P has reached it's objective in what must be one of the most unusual patterns within a fork body i have seen for some time. See the black up sloping fork where price is currently at the centre line and see the journey it has taken over the last few weeks. A brief pause perhaps & although i am still not 100% sure of the downside risk i think this market is going higher and fast. Spend 20 mins on a daily and wekly chart and you can see  there are no downsloping forks that can be drawn off the big pivots from the last few years. My guesstimate is that we will attempt to take out 1418 within days/weeks.....and all this from an eternal Bear


Thursday, 26 April 2012

EP #M12 & YM M12 The end of the correction- perhaps today?


Today and tomorrow are the days that will determine if we are in a continuation pattern for the stock indices S&P and Dow or are still flirting with the downside. It's not only my reaction line/ ML technical approach that tells me this but also many other folk watching potential bearish patterns plus other commentators who tend to more or less agree that a close this week above 1390 ( June 12 EP ) or 13100 (YM M12) will see a continuation of the long term trend up and signify the end of the recent correction with 1352.50 as the low.
 In many respects for me it is not so much PRICE that is important but TIME. What i mean by this is that for a continuation up we need to see not only new highs but pass through several reaction bar count zones which are located over the coming days. I am still uncertain and as such am not looking for a position. Price (today) i believe want's to go higher, this i observe from the manner in which it finds support when it retraces, moves up through reaction line resistance etc but I am still wary of the downside but this is slowly diminishing after recent price action.
I believe the  next few days will reveal the direction for the coming weeks perhaps months and today and tomorrows sessions will volatile and sideways.
Here is a simplified chart of the ES M12:


 and the detail showing just that one reaction line.


CAC40 & EP M12


Wednesday, 25 April 2012

Nagging doubts continued

From the last post...watch for a retest onn the black horizontal line at 1384 and then a fail and perhaps a short entry setup on the back opf that scenario... The fork is now drawn form the correct pivots 1-2-3.....and of course the blue fork is the mod Schiff relative of the grey fork.

Tuesday, 24 April 2012

EP M12 & YM M12...Nagging doubts about the downside potential

I have before on several occasions alluded to the fundamental difference between the mindset of  both pro and retail traders trading equity markets versus other commodity or currency markets. This is both a professional and personal observation (because i have a close relative who has worked in equity sales for 25 + years) and my past experience was in futures/forex markets. The difference is the mentality of equity markets are essentially 'long' orientated. Yes of course i understand there are many methods a manager or John Doe stock picker may go short either a stock or index, ETF or asset class but a cursory glance at any of the US monthly/weekly equity charts will show that these markets spend a much longer proportion of time going up than going down in trends that almost defy all the rules. They are for me different to many commodity futures markets and yes, oil,gold, copper, grains and many other have seen dramatic rises in recent years but if you look at long term CRB charts going back to the early 70's and before these markets all display different behaviour that is only apparent in a much higher time frame..... take Soybean Meal which has seen major rallies followed by major declines every few years. Cocoa, sugar, Coffee have never surpassed highs seen over 20 years ago and many others: meats /livestock, Lumber etc despite recent trends are cyclical.
Now we turn to the Indices and look at long terms charts (and we could include Gold in this as well ) and we see extended trends lasting decades. So my point that I am making is never underestimate the power of a equity market trend and those long term trends are still firmly up. I wrote a brief article last autumn on this blog just after the so called crash and subsequent hysteria in the press entitled "Crisis? What crisis?" and posted several charts showing Andrews forks with centre lines untouched by price and the somewhat insignificant retracement made by North American Indices at that time. In addition I had thought what on earth would happen to all the cash sitting on fund managers/banks/institutions books? I know enough about the industry to know that portfolio diversification into fixed income, Sovereign bonds ,Gold, commodities and other asset classes would be limited and that the vast majority of funds were just waiting to flood back their cash into the equity markets. This is a simple fact of life and remains so.
What i am saying is what i have learnt ( with my own account equity over the years)...Never underestimate the power of the equity indices to keep on trending upwards (& screw a short).
Of course the above is over simplified but i am concerned that with all my recent bearish sentiment -(based on sound technical analysis and recently traded successfully on the back of the triple tops we saw in the Dow and the fork shown in chart 1 above at the top of the page).... that i may not remember my own hard learned lessons.
 I am now starting to see the same type of stubborn support underlying the equity markets that we saw last Autumn. Here below is a chart showing last Summer/Autumn price action in relation to Andrew fork A-B-C and it's Schiff variant in blue. Remember pivot B was out high at the time ...Then note the inability of price to make a touch on the blue Schiff CL and the resulting low pivot was D.
This chart shares striking similarities with Gold at that time.... but thats another story.
The current dashed red almost horizontal down-sloping reaction line is from fork C-A-D as is the previous reaction line. The sharp angled uplsoping RL is responsible for the recent sharp up trend is from the un-Schiffed normal Andrews Fork A-B-C but it's influence is now over.


Here is the current picture below ( viz a viz pitchforks) and yet again we have the same non touch on the blue Schiff fork from pivots P0-P1-P2 shown with a green arrow...Looks familair? However if we use the lower high P3 we have a touch on the schiff CL (P0-P3-P2).

Now lets keep it simple ( for the time being) and draw the obvious fork on a daily chart below and you realise that the objective is a long way down towards 1100...a long term move and perhaps too much to ask of the market? (I should mention that regardless of if the fork is 'in play' with price, the reaction lines and ML's will still influence future path of price if they converge or meet.
Now lets drop down to the 240min and we add the RL's plus a fork off the pivots 1-2-3 and its Schiff variant in thick blue...


THIS TIME the fork and its RL's work a treat, capturing the frequency of the entire recent weeks of price action. However the higher -high pivot is not used and of course you may think its a 'fudge' because we have not used the correct pivot ( see comment**) .This forks ML's and RL's work of course because all any three pivots do is express the interrelationship between themselves and price so this is what i call a slightly "unorthodox Fork" but it would not be the first or last time they show their value....
(Postscript.**  upon reflection it's not really a fudge because if i use the correct P3  the non Schiff Andrews ML /CL bisects both this high and the previous penultimate higher high  ie the prior high to the highest high shown at 1419.50.. Try them both for yourself.)
 Here's more current detail in the 60 min below:


Here's even more detail below with some local time frame forks added which show both the up and down sloping objectives...the latter having been reached (but not exceeded yesterday). If we reach the upper blue Schiff MLH again ( as its already done its work once at pivot Z) i think we may go higher and break through to test the horizontal resistance zone (ML) at about 1383.


Here below is a current lower time frame chart of another set of forks seen above in the 3rd chart down from the top.. it shows possible down sloping MLs where we may see resistance but often in  sideways patterns they are not fully reliable... but at least we can see possible UMLP's and they are all current and in play and should be viewed in a lower time frame to do these forks justice but their reaction lines are perfect and reveal last night & todays supporting reaction line.
NB: All RL's & ML's are drawn automatically by a custom indicator so cannot be moved unless the fork pivots are changed.


IN SUMMARY:
If ever there was a day for a punch though & down  the 1350-1355 area yesterday was it. We now have a bullish double bottom having failed to make a lower low. Depending on how you count the topping sideways formation we are currently seeing (on the emini S& P June 12 contract) our 3rd, 4th or even 5th peak since the 1352.50 low on 10th April and i repeat failed to make a LL yesterday. Price is showing a reluctance to go lower and this can be seen as a "tell" . Yesterday all the 'boxes were ticked' in respect of all 'local' down sloping forks seen in the 60 min chart and they all had the CL objectives met (and no light touches or 'kiss and reverse' behaviour) so the short scenario is still in play but price must make a LL soon in my opinion or head back up towards 1380 for an eventual  retest of 1400 where it failed to forfill its obligation to touch the the thick black up sloping fork CL (see above chart 3rd form top).
I am still just bearish perhaps also impatient but a break of 1350 will confirm (for me) the possibility of a new phase of a medium term trend down to 1280-1300 but I am not yet 100% convinced that this will happen and am extremely wary of being caught short in this market. In the daily chart this is still an insignificant matter and only if we break 1338 will this correction be certified and have some teeth to it. In the meantime i have a feeling that bargin hunters are out there in the equity markets picking up stock and it would not surprise me in the next few weeks if I then realise that we have already seen the bottom- conversely a news driven headline or story ( & there are plenty out there) or crappy data could provide the impetus to go lower through crucial support but the appetite is not apparent today.... SO at the moment I am prepared for both eventualities.